
Food Poisoning Statistics and Fast Facts
Food poisoning (or foodborne disease) is an infection of the digestive tract caused by ingesting contaminated food. Even with our safe food supply, millions of Americans still get food poisoning each year. That’s because many pathogens can come into contact with food at any stage—production, processing, transportation, preparation, cooking, and storage.
How often do food poisoning outbreaks occur in the United States? Here is a comprehensive list of food poisoning statistics and fast facts in the U.S.
National Food Poisoning Statistics
The U.S. Centers for Disease Control and Prevention (CDC) receives reports of food poisoning incidents across the nation. Here are some crucial national food poisoning stats.
- About 1 in 6 Americans (or 48 million people) contract foodborne illnesses, 128,000 get hospitalized, and 3,000 die annually. (CDC)
- CDC estimates that 31 identified foodborne illness agents cause 9.4 million domestic infections, 55,961 hospitalizations, and 1,351 deaths per year based on 2011 data. (CDC)
- Unspecified foodborne agents cause 38.4 million infections, 71,878 hospitalizations, and 1,686 deaths, according to 2011 data. (CDC)
- The top five pathogens responsible for most domestic foodborne illnesses are norovirus (58%), salmonella (11%), clostridium perfrigens (10%), campylobacter spp (9%), and staphylococcus aureus (3%). (CDC)
- The top five pathogens causing domestic infections that lead to death are salmonella (28%), toxoplasma gondii (24%), listeria monocytogenes (19%), norovirus (11%), Campylobacter (9%) (CDC)
Norovirus Statistics
In the United States, noroviruses are the major cause of gastroenteritis—an intestinal infection. Here are some stats about the disease.
- The norovirus causes between 19 and 21 million incidents of vomiting and diarrhea annually. (CDC website)
- About 2,500 norovirus outbreaks are reported in the U.S. The outbreaks normally occur from November to April, and cases of illnesses increase by 50% in years when new virus strains emerge. (CDC)
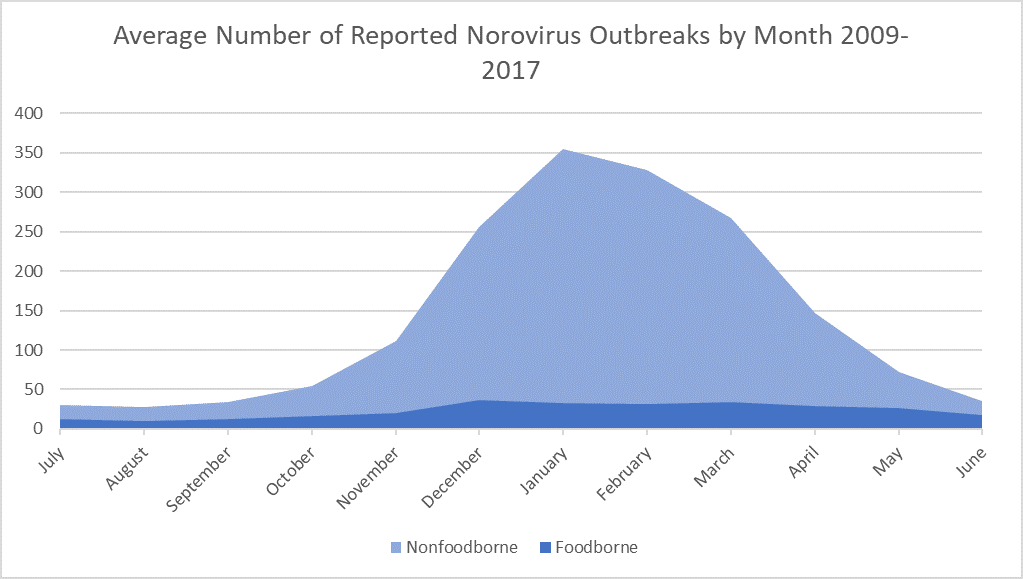
Norovirus illness per year by month - By the age of five, one in every seven children will visit an outpatient clinic, one in every 160 will be admitted to a hospital, one in every 40 will visit the emergency department, and one in every 110,000 will die from norovirus. (CDC)
- Long-term care facilities account for more than half of the norovirus outbreak cases in the U.S. (CDC)
- Norovirus is responsible for approximately half of all outbreaks of foodborne illness. (CDC)
- Norovirus results in 2.27 million outpatient clinic visits, 109,000 hospital admissions, 465,000 emergency department visits, and 900 deaths in the United States every year. (CDC)
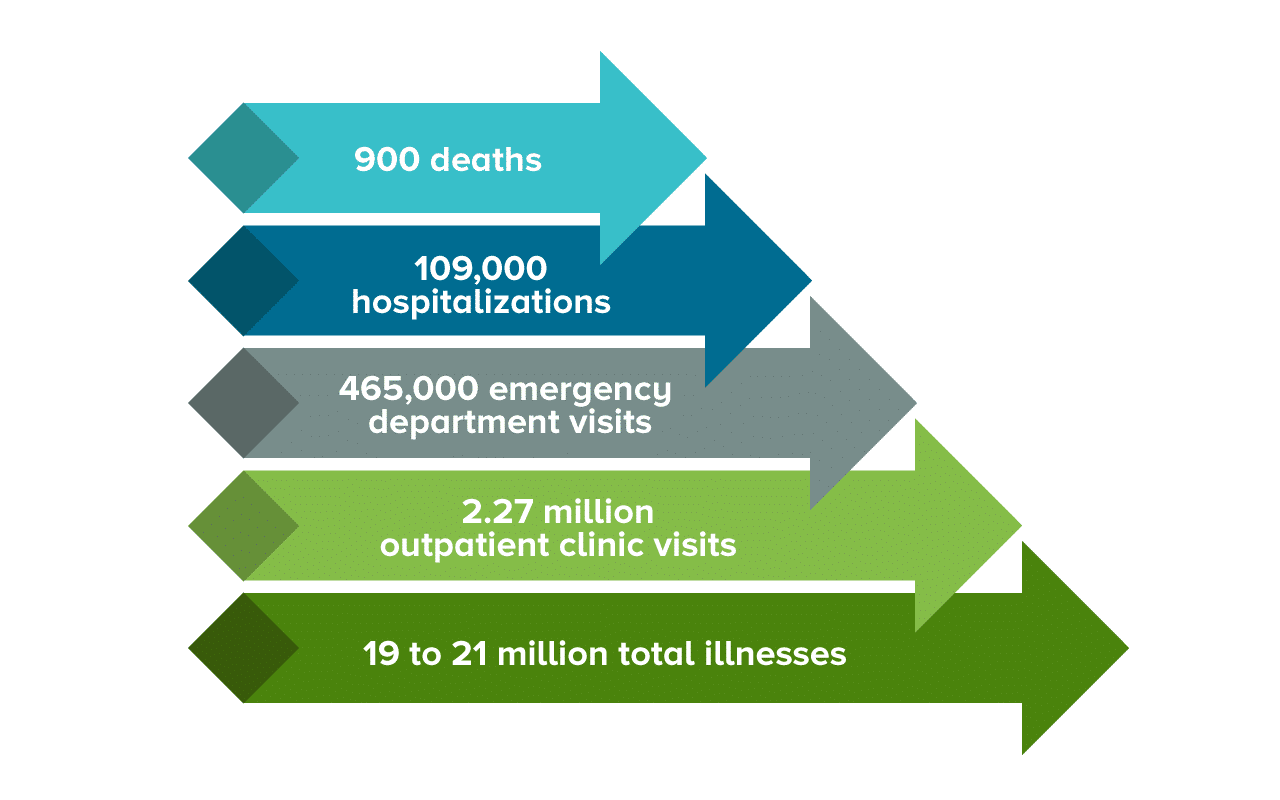
the annual norovirus disease numbers in the U.S - Norovirus is the leading cause of diarrheal illness outbreaks on cruise ships, but cruise ship cases account for about 1% of all norovirus outbreaks (CDC)
Salmonella Statistics
Salmonella bacteria were discovered in 1885 by Dr. Daniel E. Salmon. The following stats show how the Salmonella bacteria affects the U.S. population.
- Salmonella bacteria are responsible for approximately 1,350,000 illnesses, 26,500 hospitalizations, and 420 deaths annually in the United States (CDC)
- Food is the major source of the 1.35 million cases of illnesses by Salmonella bacteria (CDC) (image source)
Food is the major source of salmonella bacterial infections - 3,796 Salmonella infections and six deaths that occurred between 1991 and 2016 were associated with live poultry (Statista)
- Children under the age of five and those under the age of one year who have not been breastfed are at a higher risk of contracting a Salmonella infection. (CDC)
- Children under the age of five, pregnant women, people with weakened immune systems, people under certain medications (like stomach acid reducers), and adults aged 65 and older are at a higher risk of developing severe salmonellosis infections. (FDA) (CDC)
- Fewer than 100 of the more than 2,500 Salmonella serotypes identified by scientists cause most human salmonellosis cases. (FDA)
Escherichia coli (E. coli) Statistics
While most Escherichia coli (E. coli) bacteria are a harmless and vital part of the human and animal intestinal tract, some E. coli strains can cause illnesses. Below are some E. coli stats worth looking at.
- The Shiga toxin-producing E. coli or STEC accounts for nearly 265,000 STEC infections yearly reported in the United States. (CDC)
- The most common type of STEC in the United States is the O157:H7 strain, accounting for about 36% of all annual cases. Little is known about non-O157 STEC. (CDC)
- E. coli O157 infection was discovered in 1982 during the investigation of the hemorrhagic colitis outbreak. (Pubmed) (CDC)
- Approximately 2 – 7% of E. coli O157 illnesses trigger HUS, and about 5 – 10% of the resulting HUS cases are fatal. (Minnesota department of health)
- STEC infections result in about 3,600 U.S. hospitalizations and 30 deaths yearly. (CDC)
- Since 2009, the U.S. has seen a minimum of two multistate E. coli outbreaks each year. (CDC) (CDC)
Clostridium perfringens Statistics
In the United States, Clostridium perfringens is the third leading cause of foodborne illness. Below are some important stats and quick facts.
- Clostridium perfringens was identified in 1891 by William H. Welch, MD (NCBI)
- C. perfringens is responsible for 5% of foodborne outbreaks, 10% of illnesses, and 4% of hospitalizations yearly. (NCBI)
- The rate of fatalities for Clostridium perfringens infections is about 0.03%. (CDC)
- A C. perfringens outbreak resulting from a chicken salad at Central Louisiana State Hospital caused 40 cases and three deaths. (CDC)
- C. perfringens outbreak risks are higher in nursing homes, school cafeterias, hospitals, and prisons. (CDC)
- Most illnesses due to C. perfringens are seen in people in the age range of 20–49 and particularly in men, while people with a weakened immune system might develop complications (NIFA-USDA)
Campylobacter Statistics
While there are over 20 species of Campylobacter, 90% of human illnesses result from one species, Campylobacter jejuni.
- Each year, about 1.5 million people get Campylobacter infection in the U.S. (CDC)
- For every 1,000 cases of Campylobacter illnesses, there are 0.2 to 1.7 Guillain-Barré syndrome (GBS) cases. (CDC)
- Campylobacter triggers 41% of all GBS illnesses in the U.S. (CDC)
- Most Campylobacter infection outbreaks have been linked to unpasteurized dairy foods, contaminated water, and poultry. (CDC)
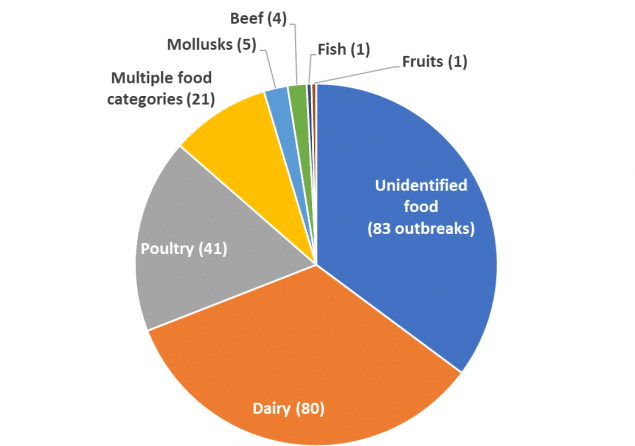
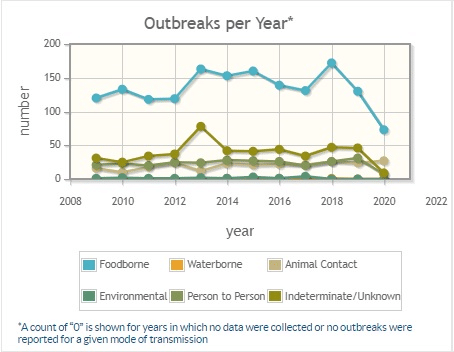
Foodborne Campylobacter outbreaks by food category, 2010-2017) - Campylobacter infections are most common in children under five years, the elderly (65 years and older), and males. (CDC)
- In 2019, there were 9,731 confirmed incidents of Campylobacter infections which reflected an increase of 13% in comparison to 2016-2018 and by 70% when compared to 2006
- 20 in every 100,000 people are diagnosed with Campylobacter infections. (CDC)
- 24% of raw chicken purchased from retailers in 2015 had Campylobacter, according to National Antimicrobial Resistance Monitoring System (NARMS). (CDC)
- About one Campylobacter infection among every five cases reported to FoodNet is linked to international travel. (CDC)
- In New York State, campylobacteriosis is a leading cause of bacterial diarrhea. (N.Y. Department of Health)
Staphylococcus aureus (Staph) Statistics
Staphylococcus aureus is a common pathogen in community settings and health care facilities. Below are important stats.
- In 2017, there were over 119,000 bloodstream Staphylococcus aureus (staph) cases in the U.S., with nearly 20,000 deaths. (CDC)
- Methicillin-resistant Staphylococcus aureus (MRSA) bloodstream infections in hospitals lowered by about 17% annually between 2005 and 2012. MRSA decreased by 6.9 percent per year in community settings between 2005 and 2016.
- There have been no significant changes in healthcare-onset methicillin-susceptible Staphylococcus aureus (MSSA), but community infections have increased by 3.9 percent each year from 2012 to 2017. (CDC)

Infographic about staph infections - In 2016, people who inject drugs accounted for 9% of serious staph infections. (CDC)
Clostridium botulinum (botulism) Statistics
Botulism affects both women and men equally. Here are some foodborne botulism stats and facts.
- About 110 cases of botulism are reported each year in the United States, and 25% are foodborne incidents. (CDC)
- The average age of those infected by botulism is 46 years. (CDC)
- Half of all reported foodborne botulism outbreaks in the U.S. since 1950 occurred in five western states—Oregon, Colorado, Alaska, California, and Washington. (CDC)
- Foodborne botulism is common among the Alaska Natives where most cases are linked to improper preparation and storage of traditional Alaska Native foods (CDC)
Cyclospora Statistics
Cyclosporiasis infection is caused by a tiny, one-cell parasite called Cyclospora cayetanensis.
- 156 Cyclospora cases were reported in 2018, which was a higher rate compared to incidents from 2008 to 2017 (0 to 23 per year) (M.N. department of health)
- Three percent of the confirmed cases in 2018 were hospitalized for an average of 3 days (M.N. department of health)
- Outbreaks of cyclosporiasis in the U.S. have been associated with different types of imported fresh produce, for example, snow peas, raspberries, cilantro, basil, and mesclun lettuce. (CDC)
- Some cases of cyclosporiasis infection in the United States have been linked to travels to Cyclospora-endemic areas. (CDC)
Listeria Statistics
In comparison to other foodborne infections, listeriosis is uncommon but deadly. Below are significant stats about listeriosis in the United States.
- An annual rate of 0.24 laboratory-confirmed listeriosis cases occurs per 100,000. (CDC)
- CDC’s National Notifiable Disease Surveillance System (NNDSS) gets about 800 laboratory-confirmed listeriosis incidents each year. (CDC)
- Listeriosis has a 20% mortality rate and is estimated to be the third leading cause of death from foodborne disease (about 260 deaths annually). (CDC)
- More than 90% of people with listeriosis are admitted to the hospital, usually to intensive care units (ICUs). (FDA)
- Pregnant women are ten times more likely to contract listeriosis when compared to other people, and pregnant Hispanic women have an increased risk of 24 times. (CDC)
Vibrio Statistics
Vibrio bacteria occur in coastal waters and are more prevalent between May and October. Most vibriosis infections result from eating raw or undercooked shellfish. Here are some vibrio stats in the United States.
- Approximately 80% of vibrio illnesses happen between May and October. (CDC)
- There are 80,000 vibriosis infections and 100 deaths annually, with 52,000 of the cases resulting from the consumption of contaminated food. (CDC)
- The most common strain (Vibrio parahaemolyticus) accounts for 45,000 cases per year in the U.S. (CDC)
- Florida has the nation’s highest cases of vibriosis, with the Indian River Lagoon region accounting for 20% of all its cases. (Florida Atlantic University)
- About 1 in 5 people who get Vibrio vulnificus infection die within a day or two of contracting the illness. (CDC)
Shigella Statistics
Shigella sonnei is the most common species of Shigella in the U.S. Check out the Shigella quick stats below.
- Shigella causes about 450,000 illnesses per year in the U.S. (CDC)
- Many Shigella outbreaks among gay, bisexual, and other men who have sex with men have occurred in the U.S. since 1999. (CDC)
- About 0.4% to 7.3% of cases of Shigella infection lead to bloodstream infections. (AAP)
- Large Shigellosis outbreaks frequently begin in childcare facilities. (Cambridge)
- One of the largest S. sonnei outbreaks happened in 2014-2015 and was associated with travelers returning from countries with ciprofloxacin-resistant shigellosis like Haiti, the Dominican Republic, and India (CDC)
Hepatitis A Statistics
- Cases of annual hepatitis A virus (HAV) infections have declined compared to 2000 but first increased to 1,562 reported cases in 2012 and 1,781 in 2013. The increase was linked to outbreaks resulting from pomegranate arils imported from Turkey. (CDC)
- From 2015 to 2016, the reported cases of hepatitis A increased from 1,390 in 2015 to 2,007 cases in 2016 due to two outbreaks associated with contaminated imported food. (CDC)
- Since 2016 reported incidents of hepatitis A have increased significantly (3,366 in 2017, 12,474 in 2018, and 18,846 in 2019) due to outbreaks, particularly among drug users, people experiencing homelessness, and men having sex with other men. (CDC)
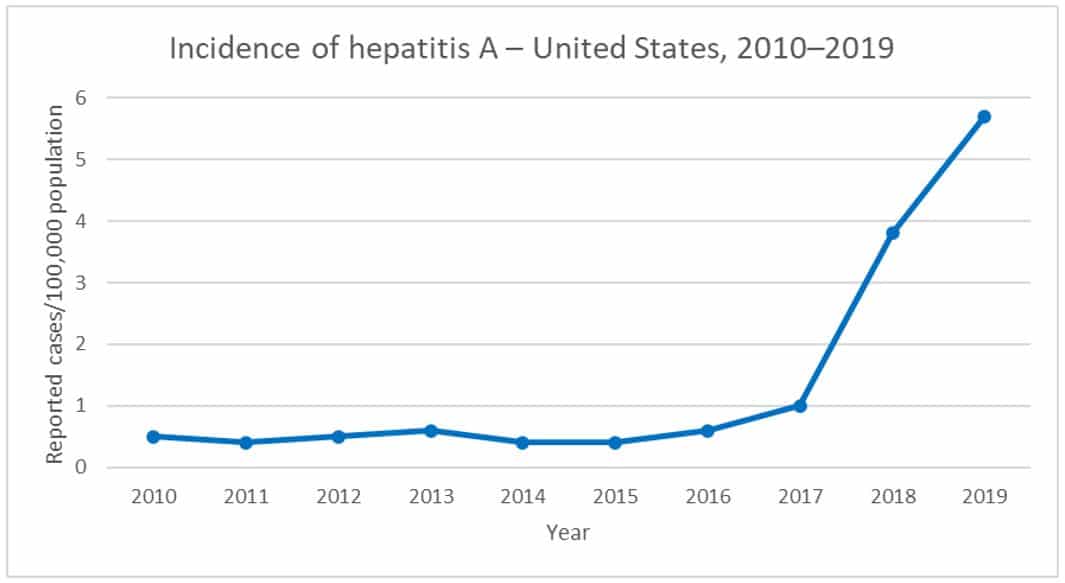
2010 to 2019. The line indicates cases per 100,000 people.
Post-Infectious Hemolytic Uremic Syndrome (HUS) Statistics
HUS is a rare infection that develops after some infections. Here are some HUS stats across the United States.
- An estimated 200-300 cases of HUS are reported annually in the U.S. (VDH)
- HUS is more common in children under five years than in other people and is a major source of acute kidney failure in children. (N.Y. Department of health)

Source: FoodNet CDC - 80% of children under 18 years who get HUS have a STEC infection. (CDC)
- Illnesses of E. coli serotype O157:H7 account for 70% of all Stx-HUS cases in North America (JASN)
- Between 1997 and 2019, there were 1,501 cases, 0.6 incidences per 100,000 children, 11 average hospitalization days, and 37 deaths. (CDC) incidence per 100,000 of post-diarrheal HUS by year.
Post-Infectious Irritable Bowel Syndrome (IBS) Statistics
Foodborne illness increases the risk of developing irritable bowel syndrome (IBS). See stats about IBS in the United States.
- IBS affects about 10–15% of the U.S. population. (AFP)
- Nearly twice as many women as men suffer from IBS. (American College of Gastroenterology)
- 1 in 5 people diagnosed with campylobacter infection develops PI-IBS (Mayo Clinic)
- Younger people (between 19 and 29 years) are three times more likely to develop PI-IBS compared to the elderly over 60 years. (IFFGD)
- People who experience psychological factors such as anxiety and depression during or before gastroenteritis have a higher risk of getting PI-IBS. (PMC)
Post-Infectious Guillain-Barre Syndrome (GBS) Statistics
Some people develop GBS after episodes of other infections. Check out these important facts and stats about GBS in the U.S.
- GBS occurs in about 3,000-6,000 people per year in the U.S. Only one in 100,000 is likely to develop GBS. (CDC)
- 40% of GBS incidents result from a Campylobacter illness. (CDC)
- About 32.8 to 49.2 incidents of GBS happened for every 100,000 Campylobacter infections in the U.S. between 2009 and 2010. (NCBI)
- Previous campylobacter infections account for 8.2 to 12.3% of all GBS cases in the U.S. (PubMed)
- About two-thirds of GBS cases are attributable to diarrhea and respiratory diseases that occur weeks before GBS onset. (CDC)
- Men and people above 50 years are at a higher risk of developing GBS. (CDC)
Post-Infectious Reactive Arthritis (Reiter’s Syndrome) Statistics
Bacterial diseases can trigger Post-infectious reactive arthritis, which can last several years and cause chronic arthritis. Here are some stats that you should know.
- Cases of reactive arthritis are 3.5 to 5 per 100,000 patients in the U.S. (PubMed)
- Gastrointestinal infections with Shigella, Campylobacter, or Salmonella account for up to 15% of post-infectious reactive arthritis incidents (NCBI)
- Reiter’s syndrome is more common in men than women, particularly between ages 20 and 50 (Hopkins Medicine)
- Approximately 2% of people infected with specific types of Shigella, usually Shigella flexneri, develop reactive arthritis after the illness. (PubMed)
Final Thoughts
Despite having one of the safest food supplies in the world, food poisoning outbreaks occur every year in the United States. The level of threat varies from case to case. It can be mild discomfort, severe illness, and sometimes lead to secondary illnesses such as reactive arthritis and post-infectious Guillain barre syndrome.
To stay safe, it’s important to pay attention to food recalls during outbreaks and always follow food safety recommendations.